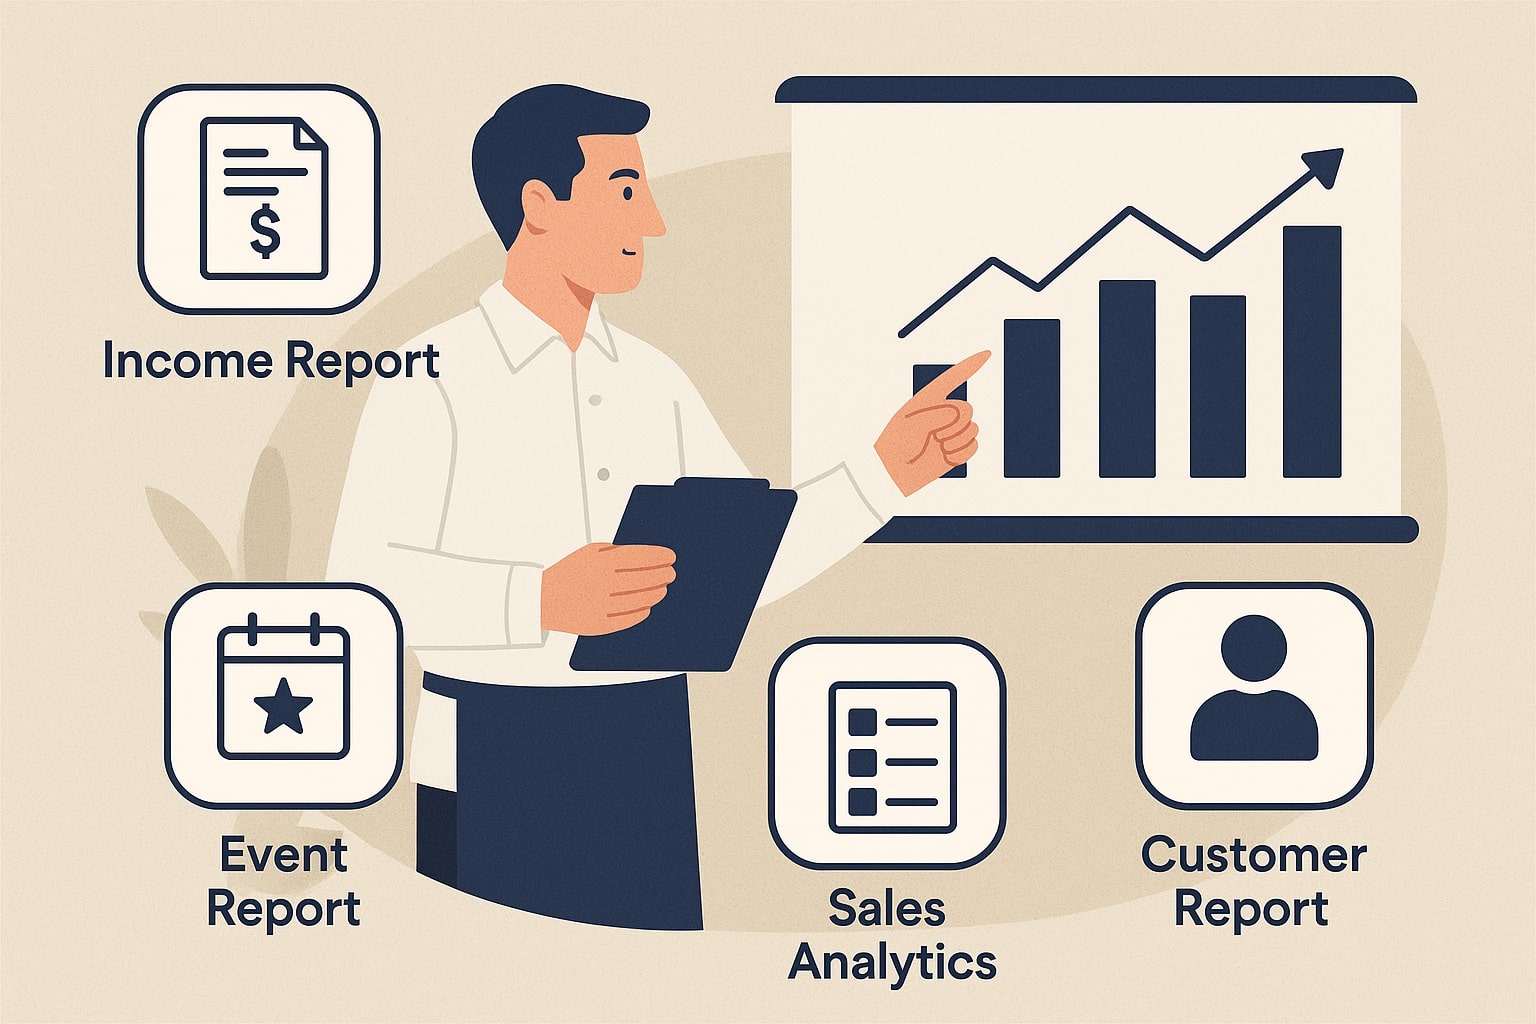
Catering management software transforms catering operations by automating tasks and providing reporting features that turn raw data into actionable insights. Modern systems generate detailed reports and dashboards covering everything from sales and expenses to customer satisfaction and inventory levels.
These reporting tools give caterers a real-time view of their business performance, enabling data-driven decisions that boost efficiency and profitability. For example, a recent industry analysis notes that catering software tracks sales, expenses, and profits in real time, offering a clear view of the bottom line.
By leveraging these reports – whether they are revenue trends, menu item popularity, or staff productivity – caterers can refine their strategies and stay competitive.
Key Takeaway: Top-tier catering management software includes built-in reporting features and analytics (often referred to as BI dashboards) that help caterers monitor financial performance, sales trends, customer behavior, and operational metrics.
These systems often support customizable reports and live dashboards, empowering both small caterers and large enterprises to analyze metrics like revenue, costs, and customer satisfaction on demand.
Real-Time Sales and Financial Reporting
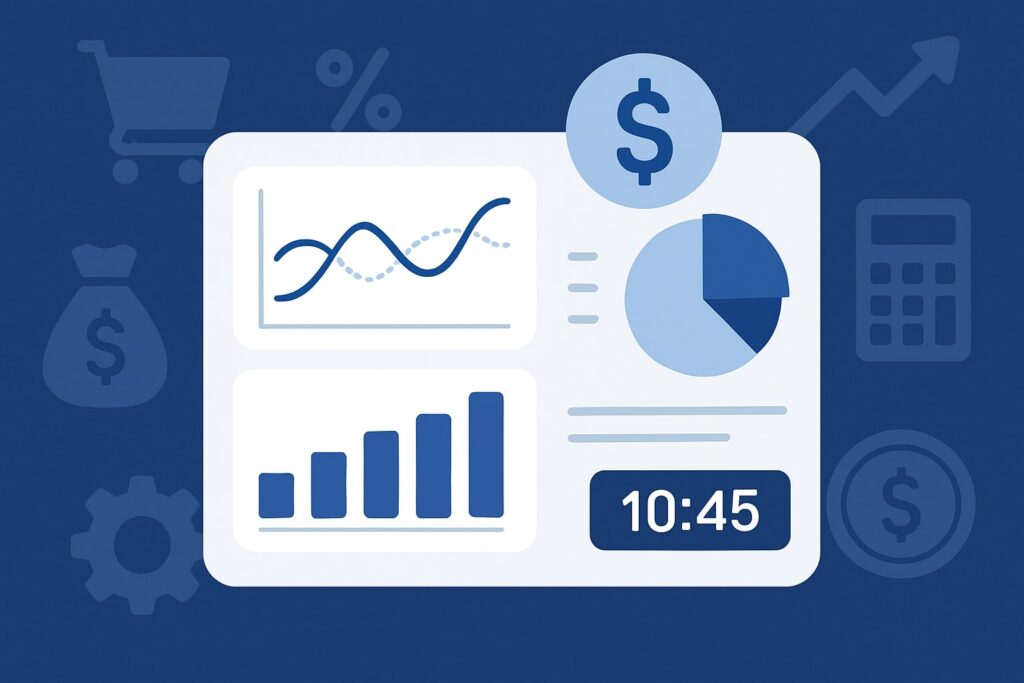
Catering software’s reporting features typically begin with sales and financial reports. These reports track daily sales, order revenue, and total profits, often updating in real time.
For instance, platforms like CaterZen and Total Party Planner provide detailed financial dashboards so managers can see sales, expenses and profits live and adjust pricing or staffing as needed.
Common sales reports include revenue by date or event type, the number of orders processed, and average order value. Financial reports go deeper: profit-and-loss statements, cash flow summaries, and expense breakdowns (food costs, labor, overhead). These figures are crucial for understanding margins on each event or menu item.
Reporting features often allow filtering and customizing these financial views. Users can generate reports for specific time ranges (daily, weekly, monthly) or compare performance across years.
Some systems even forecast future revenue by analyzing historical patterns. For example, Pipedrive’s catering dashboard can “forecast revenue” by monitoring key metrics and estimating future sales based on trends.
In practice, this means a caterer can predict demand for upcoming seasons and plan inventory or staffing accordingly.
- Revenue and Sales Reports: Display total sales by period, by client, or by event, often with trend charts and growth percentages. Real-time dashboards show today’s bookings and upcoming revenue at a glance.
- Profit & Loss Reports: Summarize all revenue against costs (ingredients, labor, venue fees, etc.) so caterers know their true profitability per event or period. Some software even automates daily P&L statements to speed up accounting tasks.
- Forecasting and Budgeting: Based on past data, some reporting modules predict future income and help set budgets. This can include break-even analysis, where the software estimates how many events or orders are needed to cover costs.
For U.S. caterers, these financial reports often integrate with accounting standards and tax categories, supporting GAAP-compliant bookkeeping. Many systems sync with popular accounting tools like QuickBooks or Xero, ensuring sales and expense data feed directly into financial records.
This two-way integration means generated invoices, receipts, and payroll data can automatically populate in reports, eliminating manual reconciliation and providing up-to-date financial insight.
Inventory, Cost, and Production Reporting
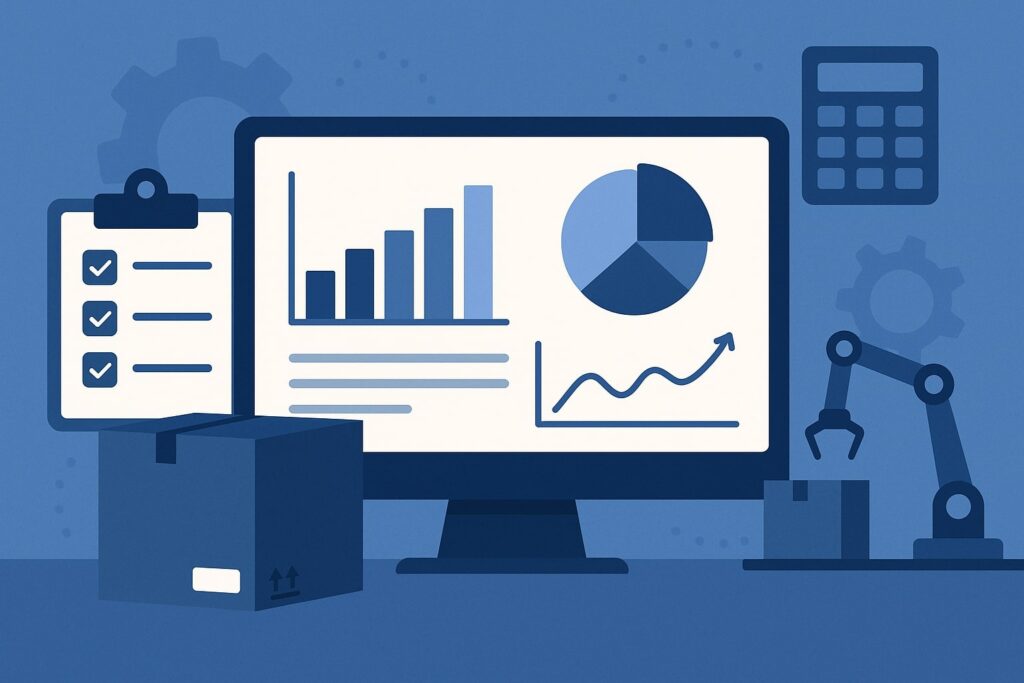
Beyond sales, catering reporting features include inventory and production reports that help manage food costs and kitchen operations. Inventory reports track stock levels of ingredients, supplies, and equipment.
A chef or manager can see which items are running low and generate shopping lists or purchase orders directly from the system. This automation ensures essential ingredients are reordered in time, reducing the risk of shortages.
Key reporting tools in this area typically include:
- Inventory Usage Reports: Show the quantity of each ingredient used over a period or per menu item. Caterers can review which dishes consume the most resources. For example, a report might reveal that a certain salad uses 50 lbs of lettuce per week, helping optimize ordering.
- Waste and Shrinkage Reports: Compare what was ordered vs. what was used to identify waste. If a recipe calls for 20 lbs of chicken but only 18 lbs are served, the difference can be tracked. Over time this data can reveal spoilage issues or portion inconsistencies.
- Food Cost Reports: Calculate the cost of ingredients used for each event or menu. By combining recipe definitions with inventory pricing, the software can generate per-event cost summaries and overall food-cost percentages. This is critical for maintaining profitability.
- Kitchen Production Reports: Detail event-by-event production. For example, CaterZen offers “kitchen production reports” that break down cooking tasks by order and aggregate them by day.
These reports list how many of each item or recipe to prepare (say, 200 sandwiches and 50 salads today), helping kitchen staff plan labor and prep efficiently.
Accurate cost reporting is vital for catering businesses, especially in the U.S. where food costs and labor laws directly impact budgets. Advanced systems provide customizable menus and recipe management, so when a price change occurs (e.g., seasonal fluctuations in ingredient cost), the reports automatically update to reflect the new values.
This ensures cost reports are always up-to-date. Additionally, some platforms offer waste audit reports that cater to food safety compliance by documenting discarded items or allergens, which can be important for regulatory reporting or insurance.
Overall, robust inventory and production reports help caterers minimize waste and maximize resource use. Data from these reports enables decisions like adjusting menu offerings (eliminating low-selling or high-waste items) or renegotiating supplier contracts when certain ingredients are consistently expensive.
In short, integrated inventory and production reporting ensures food preparation is both efficient and cost-effective.
Customer and Event Performance Analytics

Catering management software often embeds customer and event analytics to help businesses understand their clients and event outcomes. These reporting features aggregate customer data and event history to highlight trends, repeat business, and areas for growth.
Key reports include:
- Customer Reports/CRM Analytics: These show metrics like number of repeat clients, average order per client, and client lifecycle stage.
For example, a caterer can run a report on all corporate clients with contracts above a certain value, identifying their most valuable customers. By analyzing customer behavior and preferences, the system can even recommend upsell opportunities (e.g., popular add-on menus).
This CRM integration is crucial: some catering CRMs (like CaterZen) allow logging all client interactions, so the reporting suite can cross-reference event data with client profiles. - Event Performance Reports: Focus on the events themselves. These include attendance versus booked guest counts, event profitability, and on-time delivery rates.
For instance, a report might compare projected revenue versus actual costs for each event, or show how often events start on schedule. These insights help managers identify bottlenecks (e.g., late deliveries or staffing shortfalls). - Booking and Utilization Trends: Track metrics such as number of events per week/month, seasonal booking patterns, and peak days. These trends let caterers predict busy periods and adjust staffing.
For venues offering on-site catering, occupancy and revenue per event space can also be reported, integrating with venue management modules. - Marketing ROI Reports: By tying marketing campaigns or referral sources to new orders, some systems can report on the effectiveness of promotions. For example, after sending a targeted email, a report could show how many inquiries or bookings resulted from that campaign.
These customer/event analytics are especially powerful when visualized on dashboards. They allow a business owner or consultant to see, for example, that 20% of clients generate 50% of revenue, or that repeat bookings have increased by 15% year-over-year, prompting efforts to nurture top customers.
According to one guide, catering software’s reporting and analytics capabilities let businesses “generate detailed reports on sales, customer behavior, and event performance,” leading to better-informed decisions.
For US-based caterers, detailed customer insights are important for retaining high-value clients and for compliance with contracts (e.g., government or corporate clients may require reporting on service metrics).
Moreover, cross-referencing events and customer data helps ensure contractual terms (like headcounts or dietary restrictions) were met, which can be documented in audit reports if needed. Overall, customer and event reports transform raw booking data into a story about what works well and what can be improved.
Customizable Dashboards and Business Intelligence
A standout trend in catering reporting is the rise of customizable dashboards and BI tools built into management software. Instead of static spreadsheets, modern systems provide interactive dashboards that display key performance indicators (KPIs) at a glance.
Users can tailor these dashboards to show the data most relevant to their role: salespeople see booking trends and pipeline metrics, while operations managers might track kitchen prep and delivery performance.
These tools typically support:
- Custom Report Builders: Users can create bespoke reports by selecting fields, filters, and groupings. For example, a user might build a report showing total sales by menu category, or inventory usage filtered by event type.
FoodStorm highlights that it offers “dozens of reports and even the capability for custom reports built for each caterer’s specific needs”. This means a small local caterer can quickly generate a report focused on their weekly drop-off orders, while a large corporate caterer might build a report for their national events. - Flexible Filtering and Drill-Down: Good reporting tools allow slicing data by date ranges, client segments, locations, or other dimensions. For instance, an event planner might compare corporate vs. wedding catering profits, or filter sales reports by marketing campaign source.
Event Temple notes that hospitality reporting software should offer “multi-dimensional filtering (by event type, client segment, revenue source)” so that each user “looks at the data that matters most”. - Visual Dashboards: Charts, graphs, and heat maps make data easier to interpret. FoodStorm’s Catering Dashboard is a prime example: it displays charts for catering sales, popular products, customer feedback ratings, sales pipeline, repeat customers, and sales by location on a heat map.
Seeing “sales by location” on a map, for instance, can help target underperforming regions. Color-coded graphs of monthly revenue vs. goal can immediately highlight if the business is on track. - Alerts and Scheduled Reports: Many systems let users schedule automatic report generation or alerts. For example, the software can email a daily sales report to managers each morning, or send a notification if inventory of a critical ingredient falls below a threshold. This automation ensures important insights aren’t missed.
Crucially, these BI dashboards are often built into the software rather than requiring a separate analytics tool. As FoodStorm explains, their Catering Dashboard provides “the power of BI software built directly into their catering management software,” making complex analytics user-friendly.
Permissions can be set so that different roles see only relevant data. For instance, a junior manager may access high-level summaries, while an owner or analyst can drill into the raw data.
For both small and large caterers, customizable reporting means the software adapts to their needs. A small catering company might use the out-of-the-box dashboard and occasional sales reports, whereas a large enterprise could deploy advanced analytics across multiple departments.
Enterprise users benefit from features like cross-property roll-up (consolidated reporting across branches) and role-based access mentioned by Event Temple, ensuring that executive leadership and local managers each see appropriate aggregated or detailed views.
In summary, modern catering software’s reporting features emphasize flexibility and insight visualization. They put the “analytics” into the hands of non-technical users, so that anyone can query data and generate graphs without coding.
As one expert notes, customizable reports and dashboards let caterers “track essential metrics such as revenue, expenses, and customer satisfaction” and then act on that information.
Integration and Data Synchronization
Top catering management systems ensure that reporting is not done in isolation. Integration with other business tools amplifies reporting power.
For example, most catering platforms can link with accounting software (like QuickBooks or Sage) to import financial data, or with CRM and marketing apps to import customer interactions. This creates a unified data ecosystem for richer reports.
Important integration features include:
- Accounting Software Integration: By syncing with accounting platforms, the software can automatically pull in costs (vendor invoices, payroll) and push out sales data (invoices, revenue).
This eliminates manual entry and ensures financial reports reflect actual ledgers. For instance, sales and expense data in the catering software flow into the accountant’s system, so the P&L and balance sheet reports are always up to date.
Conversely, payroll or utility costs entered in the accounting system can be pulled into cost reports in the catering software. - CRM and Marketing Systems: If the catering tool connects with a CRM or email marketing service, customer data stays in sync. This allows reports that tie marketing campaigns to bookings – for example, identifying how many event inquiries came from a particular email blast.
FoodStorm’s Catering Dashboard even tracks website traffic and abandoned carts, implying integration with online ordering systems. These cross-system reports help answer questions like “which ad campaign generated the most catering bookings?” - Point-of-Sale (POS) and Venue Systems: For caterers who also run on-site cafes or work with third-party venues, integrating POS or venue booking systems can enrich reports.
Catering software might ingest daily sales from a banquet hall’s POS, enabling combined revenue reports. Likewise, linking with a venue booking system allows reports that correlate space rentals with catering revenue, ideal for full-service event centers. - Data Import/Export and APIs: Many caterers rely on spreadsheets or legacy databases. Good reporting tools allow importing historical data or exporting report data to CSV/Excel for offline analysis. Some software provides APIs so developers can pull data directly for custom BI applications.
By syncing data across systems, reporting becomes more comprehensive. For example, with accounting integration, managers can run a report on “net profit by event” that automatically includes direct catering costs and overhead from accounting entries.
As the swipesum guide notes, catering software’s integration with other systems (PMS, CRMs, accounting) helps “create a cohesive workflow” and prevent data silos. In practice, this means a caterer won’t double-enter client information and can trust that reports are pulling from a single source of truth.
Data synchronization also ensures reports are real-time. If an order is placed on a mobile app or payment is processed, the sales report updates immediately.
For US-based operations, integration with online payment gateways ensures that revenue reports include all transactions (credit card, ACH) and that tax reporting is accurate. Overall, seamless integration makes reporting features a reliable backbone for decision-making, since they reflect all facets of the business.
Mobile Accessibility and Cloud Reporting
Modern catering software is usually cloud-based and mobile-friendly, meaning reporting features are accessible anywhere, anytime. This is especially important in catering, where managers and staff often work on-site or in kitchens. Key aspects of mobile/cloud reporting include:
- Cloud Dashboards: Dashboards are hosted in the cloud, so authorized users can log in from any browser or device. A catering owner could review the day’s sales dashboard on a tablet while visiting an event site.
Cloud architecture also means data is centralized and always up to date – no need to manually transfer or sync data between offices. - Mobile Apps and Alerts: Many systems offer mobile apps (iOS/Android) with dedicated reporting screens. Alerts and notifications (e.g., low inventory warnings or missed invoices) can be pushed to smartphones.
For instance, if the inventory report flags an ingredient shortage, a manager could receive a mobile alert and order more supplies on the spot. - Offline and Sync Capabilities: Some software allows basic data entry offline (e.g., taking orders via a tablet) which then syncs to the cloud when connectivity is restored. The reports then update with that data, ensuring accuracy even if Wi-Fi is spotty during an event.
- Collaborative Reporting: Cloud platforms often let multiple team members access reports concurrently.
Administrators can set user permissions so that, say, accountants have access to financial reports, while sales staff only see booking reports. Role-based dashboards (as mentioned by Event Temple) ensure the right team sees relevant data.
The mobile/cloud approach enhances responsiveness. For example, at a large corporate event, a sales manager could open the app to check remaining budget or past client spending before proposing an add-on.
On the go, they might email a built-in report summary to colleagues directly from their phone. Since the software stores data securely in the cloud, all users work from the same dataset, eliminating version conflicts.
In summary, mobile access means reporting features are not confined to the office. Whether in the field, at a vendor meeting, or on a delivery route, stakeholders can pull up performance reports.
This aligns with the industry trend: Event Temple highlights that reporting solutions should be mobile-first, allowing “secure access to critical data whether you’re walking the property, meeting with clients, or traveling”. For US-based caterers, this on-demand reporting can improve responsiveness to clients and vendors alike.
Scalability, Security, and Enterprise Reporting
Reporting needs grow as a catering business expands. Good catering software supports both small businesses and large enterprises. Key features for scalability and security include:
- Multi-Location and Multi-Account Reporting: Enterprise caterers (e.g., school districts or global caterers) may have many locations or accounts. The software should roll up data from all branches into consolidated reports.
Spoonfed emphasizes “multi-account management” that simplifies “the reporting and exporting of key data” across accounts. This means a catering director can view total revenue for all offices or drill down to each site’s performance. - Multi-Currency and Multi-Language (if applicable): Large organizations with international operations need reports that can handle different currencies and languages. While US-focused, many systems offer these features for multi-national clients. Reports can convert currencies for a unified financial view.
- Role-Based Access and Data Security: Security is critical when reports contain sensitive financial or customer data. The software should offer granular user permissions (who can run or view which reports) and audit logs.
Single Sign-On and two-factor authentication may be supported to protect data. As Spoonfed notes, they offer “controlled access with advanced criteria” for user permissions. In practical terms, this keeps confidential data safe while still allowing stakeholders to get the reports they need. - Data Encryption and Backups: Enterprise-grade software encrypts report data in transit and at rest, ensuring compliance with privacy standards. Cloud platforms usually take regular backups, so historical report data isn’t lost.
This also facilitates compliance reporting (e.g., tax audits or contract compliance checks) by preserving all relevant transaction records. - High Volume Data Handling: Large caterers generate huge volumes of transactions. Reporting systems must process this data without slowdowns.
Many use cloud BI engines to quickly generate complex reports on tens of thousands of orders. They may also offer the ability to archive old data to optimize performance.
Scalable reporting means that whether you cater a dozen weddings a year or thousands of corporate events, you can get meaningful analytics. Small caterers might start with basic profit/loss and sales reports, while growing businesses could upgrade to advanced BI dashboards and automated report distribution.
Importantly, cloud-based catering systems can scale resources on demand, avoiding the hefty upfront costs of on-premise solutions and letting even small businesses benefit from enterprise-style reporting. As an industry report noted, cloud catering software “adapts” to events of any size and offers scalability without hefty costs.
Frequently Asked Questions
Q.1: What types of reports do catering management systems typically include?
Answer: Most systems offer a wide range of reports covering sales, events, inventory, finances, and customer data. For example, you can generate sales reports (by date, client, or item), profit-and-loss statements, inventory usage and reorder reports, kitchen production logs, and customer activity reports.
Many also provide marketing or CRM reports if integrated with email campaigns. The exact reports depend on the software, but top platforms usually include all essential categories plus the ability to build custom reports.
Q.2: How do dashboards improve decision-making in catering?
Answer: Dashboards present key metrics at a glance with charts and graphs. Instead of sifting through spreadsheets, you see trends immediately (e.g. which menu items sell best or which days are busiest).
This real-time visualization helps managers spot issues early (like a sudden drop in orders or a surge in expenses) and respond quickly. For instance, seeing a sharp increase in ingredient costs on a dashboard might prompt immediate supplier negotiations.
According to experts, having a live analytics dashboard “turns reactive management into proactive revenue optimization”.
Q.3: Can these reporting tools integrate with other software?
Answer: Yes. Leading catering software platforms are built to integrate with accounting (QuickBooks, Xero), CRM/marketing tools, POS, and online ordering systems.
Integration means data flows seamlessly: e.g. sales from your catering orders auto-update your books, or client data from a CRM is available in catering reports. This unified data ensures reports are comprehensive.
Event Temple highlights that reporting solutions should integrate with systems like PMS, CRM, POS, and accounting, creating a 360° view of the business.
Q.4: Are reporting features suitable for small caterers or only for large operations?
Answer: Reporting features scale to both. Small local caterers benefit from basic dashboards and simple reports (daily sales, inventory alerts, etc.) to run efficiently. Larger businesses can exploit advanced features like multi-location roll-ups and enterprise analytics.
Most cloud-based catering systems offer tiered pricing, so a small business can start with standard reporting tools and upgrade as it grows. In all cases, even simple reporting (revenue vs. cost per event, low-stock alerts, etc.) can provide a major efficiency boost.
Q.5: How secure and up-to-date is the data in reports?
Answer: Modern catering software is typically cloud-hosted, with encryption and regular backups. Data sync is real-time, so reports reflect the latest transactions (sales, inventory changes, etc.). Role-based access ensures employees only see reports they are authorized for, and audit logs track any data changes.
Many systems also allow scheduling report generation (e.g. an automated weekly profit report sent to management) and sending them by email securely. Thus, catering companies can trust that their reporting data is both current and protected.
These reporting features together make catering management software an indispensable tool for caterers of all sizes. By leveraging integrated, customizable reports and dashboards, catering businesses in the U.S. and beyond can gain deep insights into their operations, drive efficiency, and grow with confidence.
Conclusion
Comprehensive reporting features are at the heart of any modern catering management system. From real-time financial dashboards to customizable business intelligence tools, these features enable caterers to track sales, control costs, analyze customers, and optimize operations.
Whether you run a small local catering service or a large enterprise catering chain, selecting software with robust reporting and analytics is essential. Such tools not only streamline day-to-day management but also drive strategic growth by turning data into insight.